Test a waiting room
Follow this tutorial to test your waiting room behavior in response to load. To accurately simulate traffic through your waiting room with a load test, run your test script or planner for a period of time longer than a minute, ideally more than 2-3 minutes. You can run a load test using a variety of tools including loader.io, jmeter, and postman.com. You can also write a plain shell script to simulate user requests (each representing a distinct user).
Before you begin
Before you start this tutorial, ensure you have:
- All the prerequisites completed.
- For this tutorial, we will use an open source tool from Apache, JMeter. You can download the binary from JMeter’s website.
1. Download sample script
First, download the sample JMeter plan (configuration file) from GitHub.
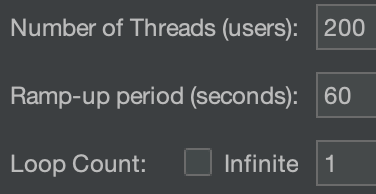
This sample plan simulates 200 active users visiting the site, slowly ramping up traffic within the first minute and then maintaining 200 active users for the next three minutes. The test plan for this tutorial follows the setup outlined in the next steps.
2. Edit and run the sample plan
Before running the sample plan, edit the waiting room in the test plan to point to your own waiting room.
- Select Waiting Room Simulation to expand the test plan and then select Request origin with waiting room to update the test configuration.

- In the HTTP Request section update the Protocol, Server Name or IP, and Path fields to point to your test URL with waiting room enabled. For example, if your full URL looks like
https://www.example.com/deals/summer, then the fields should match as the following:
| Field | Value |
|---|---|
| Protocol | https |
| Server Name or IP | www.example.com |
| Path | deals/summer |

Then, select the play button to get the test started. This should take roughly around 3-4 minutes.

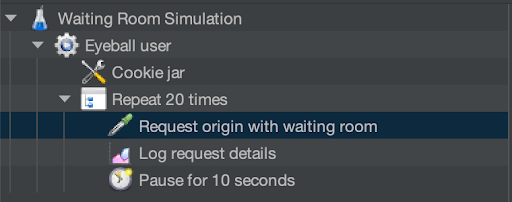
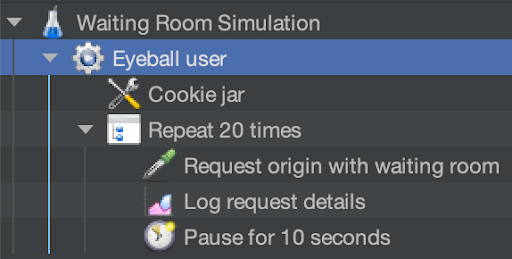
Each simulated user has the following attributes:
Contains a Cookie jar for cookies persistence.
Repeats for 20 times.
- Makes a request to the origin site with waiting room enabled.
- Logs request details.
- Pauses for 10 seconds before refreshing the page to make another request to the origin site.

Per the plan above, each Thread Group performs the above action once. The user traffic ramps up within the first minute and keeps a sustained traffic for the next three minutes before users leave the site. You can send more or less traffic than what is being sent in this example by updating these properties.

3. Analyze results
To analyze the results of your test, you can query Waiting Room Analytics (Beta) via Cloudflare’s GraphQL API to check Total Active Users and Queued Users for each minute of your load test.Example Curl Statement
From our test, we got the following results (these are extracted from results of the query for readability):
15:35:00 UTC
"totalActiveUsers": 137,"totalActiveUsersConfig": 300,"totalQueuedUsers": 0
15:36:00 UTC
"totalActiveUsers": 200,"totalActiveUsersConfig": 300,"totalQueuedUsers": 0
15:37:00 UTC
"totalActiveUsers": 200,"totalActiveUsersConfig": 300,"totalQueuedUsers": 0
15:38:00 UTC
"totalActiveUsers": 200,"totalActiveUsersConfig": 300,"totalQueuedUsers": 0
The first minute mark, 15:35:00 UTC, shows 137 active users past the waiting room. This is because our traffic was set to gradually ramp up within the first minute and the test did not start exactly at the minute mark. When data was aggregated for the following minute, 15:36:00 UTC, the waiting room reported the total 200 users active we expected on the site as each “user” made subrequests. The active user count remained stable at 200 as long as it received subrequests from the traffic sent by the load test.